Housing Price Index: 2020–2025 (What Happened and Why)

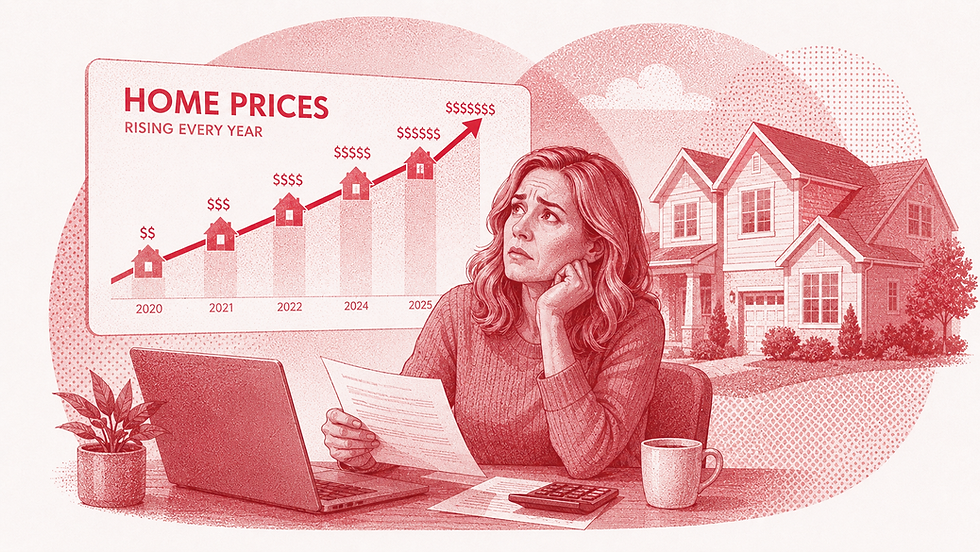
From 2020 to 2025, U.S. home prices rose every year—and not by a little bit. The biggest jumps came in 2021, 2022, and 2023, caused by a basic supply and demand imbalance.

With the Covid-19 Pandemic response as a backdrop:
Mortgage rates fell sharply to historic lows (making homes more affordable)
Millions of people wanted to buy homes at the same time
The supply of homes available to buy could not keep up with demand
Payments of cash to Americans and Companies (Covid Stimulus Programs) increased available cash, adding an accelerant to the home price equation.
“Work From Home” initiatives increased home upgrade demand.
With too many buyers vying for too few available homes, and excess cash providing buying power, prices climbed quickly. Mortgage rates later increased and home buying demand did eventually cool down. But home prices have not yet retreated to pre-pandemic levels.
-------------
What to Watch For Next (2026–2027 HPI Reports)
As you look ahead to the Housing Price Index for 2026 and 2027, pay attention to whether home prices begin to retreat to pre-pandemic price levels.
Pay close attention to the 30-year mortgage interest rate. In 2020, Mortgage rates dipped below 2.9%. Today, rates are in the 6%-7% range. Higher interest rates make buying a home more difficult for young buyers with less available income to devote to a monthly mortgage payment.
--------------
When there is a shortage of buyers for homes, prices will begin to fall. Maybe prices just get cheaper, or home builders begin building smaller homes with fewer features, smaller lots, a more suburban location, or some combination of many elements. Watch the news for trending comments like: “Starter Homes” or “Affordable Homes”. Or existing home sales may surge if buyers want to take a chance on an older home that may need some upgrades.
Markets operate on the concept of supply and demand. When prices are too low, more buyers appear. When prices are too high, buyers will disappear. Eventually, the markets settle somewhere in between those extremes.
The FHFA HPI® is a comprehensive collection of publicly available house price indexes that measure changes in single-family home values based on data that extend back to the mid-1970s from all 50 states and over 400 American cities. Data provided by Federal Housing Finance Agency (FHFA) . Visit FHFA.gov.



Comments